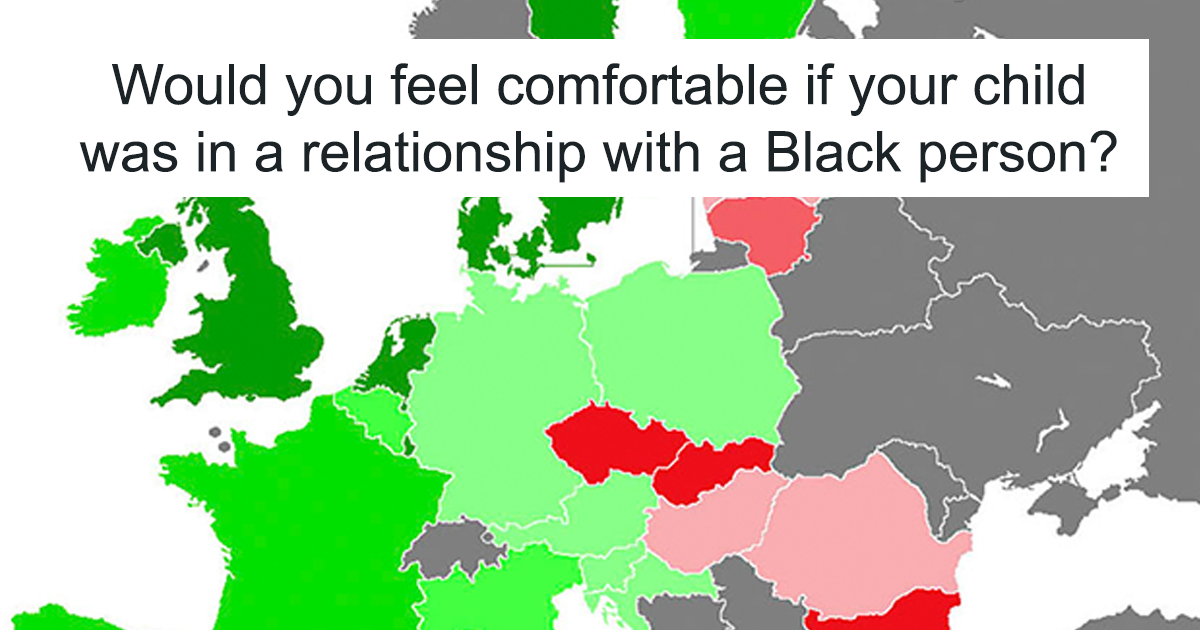
Maps can show mountains, highways, election results, and precisely how lost you became after ignoring your navigation app. Measuring racism, however, is considerably messier. A viral map may color one European country red and another blue, but that does not make it a definitive moral scoreboard for an entire continent.
The widely shared maps claiming to reveal Europe’s most racist countries generally rely on survey questions about neighbors, migrants, religious minorities, or personal experiences of discrimination. Each question measures something meaningful, but none captures racism in its entirety. Public attitudes, workplace discrimination, police treatment, hate crimes, housing access, political rhetoric, and online harassment can all produce different rankings.
So, which European countries appear worst in the available research? The honest answer is that it depends on what type of racism is being measured, which minority group is being studied, and when the survey was conducted. France performed poorly on an influential older racial-tolerance map. Hungary, Croatia, Latvia, and Slovakia scored poorly on migrant acceptance. More recent research involving Black residents found particularly high levels of reported discrimination in Germany, Austria, and Finland.
That is not a contradiction. It is a reminder that racism has more than one address.
“`
What the Famous European Racism Map Actually Measured
One of the best-known maps originated from an analysis of World Values Survey data published by The Washington Post in 2013. Respondents were shown a list of people they might not want as neighbors. Researchers focused on those who selected “people of a different race.” Countries with higher percentages were presented as less racially tolerant.
The resulting map was dramatic, colorful, and perfectly designed for an internet argument before lunch. Within Europe, France appeared unusually intolerant, with approximately 22.7% of respondents in the underlying data saying they would not want a neighbor of another race. Several Balkan countries also displayed comparatively high levels of discomfort.
The Map Did Not Ask, “Are You Racist?”
That distinction matters. The survey measured one stated residential preference. It did not examine whether employers rejected applicants because of their names, landlords treated minority tenants differently, police used racial profiling, or schools segregated Roma children.
Someone may happily tell a pollster that they welcome diverse neighbors while quietly discarding every job application from a person with an African, Arab, Turkish, or South Asian name. Another respondent may answer the survey bluntly but behave more fairly in daily life. Human beings are inconvenient that way.
Some Results Were Collected in Different Years
The original map also combined survey findings gathered at different times. Political events, immigration patterns, economic crises, terrorist attacks, wars, and public debates can alter social attitudes rapidly. A country’s result from one period should not be treated as an eternal national personality.
There is also the problem of social desirability. People living in societies where openly racist statements are strongly condemned may be more likely to hide their prejudices from interviewers. Consequently, a low survey score can indicate genuine tolerance, reluctance to admit intolerance, or some combination of both.
What Newer Research Says About Racism in Europe
Recent surveys provide a broader and more complicated picture. Rather than asking only what majority populations believe, some researchers ask minority residents what they have personally experienced. This changes the view dramatically.
Germany, Austria, and Finland: High Reported Anti-Black Discrimination
A major report from the European Union Agency for Fundamental Rights examined the experiences of people of African descent in 13 EU countries. The research covered thousands of first- and second-generation residents and asked about discrimination in employment, housing, education, public services, and everyday life.
Across the countries studied, 34% of respondents said they had experienced racial discrimination during the previous 12 months. The figure reached 64% in both Germany and Austria, while Finland recorded 54%. Looking across a five-year period, Germany had the highest reported rate, at 76%.
Those results do not mean that 76% of Germans are racist. They mean that 76% of the Black respondents surveyed in Germany reported at least one discriminatory experience during the measured period. That could involve repeated incidents committed by a much smaller number of individuals or institutions.
Germany also recorded the highest rate of racist harassment in that study. The findings are particularly striking because Germany has strong constitutional protections, extensive Holocaust education, visible anti-racist organizations, and significant public opposition to far-right extremism. Progressive laws and discriminatory experiences can exist in the same country at the same time.
Portugal, Sweden, and Poland: Lower Results in the Same Study
Portugal and Sweden reported some of the lowest levels of harassment among Black respondents in the EU study. Along with Poland, they also showed comparatively low levels of reported racial discrimination.
However, this is not a universal certificate of tolerance. Poland has been criticized over anti-immigrant rhetoric, antisemitism, and hostility toward other minorities. Sweden has experienced debates over residential segregation, gang crime, immigration, and far-right politics. Portugal continues to face concerns involving Roma communities, policing, housing, and its colonial legacy.
A country can perform relatively well for one population and poorly for another. Racism is not a single exam with one final grade.
Migrant Acceptance Produces a Different European Map
Gallup’s Migrant Acceptance Index asks whether respondents view migrants living in their country, becoming their neighbors, and marrying into their family positively. In its 2019 measurements, Hungary, Croatia, Latvia, and Slovakia were among the least accepting countries in Europe. Several Balkan states outside the European Union also received very low scores.
Sweden, Ireland, and Iceland appeared at the more accepting end of the European spectrum. These results suggest a broad geographical pattern, with portions of Northern and Western Europe expressing greater migrant acceptance than parts of Central, Eastern, and Southeastern Europe.
Yet migration attitudes are not interchangeable with racial attitudes. Opposition to immigration may involve economic concerns, nationalism, religion, security fears, cultural anxiety, or racial prejudice. These motivations often overlap, but automatically labeling every person who favors lower immigration as racist would turn analysis into a very blunt instrument.
The reverse is also true. Supporting immigration in theory does not guarantee that someone treats existing minority residents equally.
Anti-Roma Prejudice Changes the Ranking Again
Roma communities have lived in Europe for centuries and continue to experience exclusion in housing, education, employment, healthcare, and public life. Pew Research Center polling found that unfavorable views of Roma were widespread across much of the continent.
In a 2019 survey of 16 European countries, at least half of respondents in 10 countries expressed an unfavorable opinion of Roma. Italy produced the most negative result, with 83% reporting an unfavorable view. Central and Eastern European countries also showed substantial hostility, although opinions varied considerably among countries and demographic groups.
Northern European respondents generally expressed more favorable opinions. Education and political ideology were associated with attitudes, with more highly educated and left-leaning respondents typically reporting more positive views.
These findings underline a major weakness in generic maps of racism in Europe. A survey that asks only about “people of another race” may fail to capture discrimination against Roma, who are often targeted through ethnic stereotypes that respondents may not categorize as racial prejudice.
Antisemitism Creates Yet Another Pattern
Research on antisemitic attitudes produces a different list of concern. A 2023 Anti-Defamation League survey found comparatively high levels of antisemitic beliefs in Hungary and Poland among the Eastern European countries examined. In Western Europe, Spain and Belgium recorded higher index scores than France, Germany, the United Kingdom, and the Netherlands.
The Netherlands achieved the lowest overall score in that particular survey, yet notable minorities still accepted individual stereotypes about Jewish influence or loyalty. A relatively good national score should therefore never be confused with the absence of prejudice.
Reported incidents can also move differently from measured attitudes. Political crises and international conflicts may cause sudden increases in antisemitic harassment even when long-term opinion polls show modest improvement. The same principle applies to anti-Muslim hatred and hostility toward refugees.
Why France Looks Bad on One Map but Not Every Map
France became the attention-grabbing European result in the old World Values Survey map. Its estimated 22.7% objection to neighbors of another race seemed surprising for a country built around the republican promise of liberty, equality, and fraternity.
France’s approach to race also creates measurement challenges. The state traditionally emphasizes universal citizenship and generally avoids collecting extensive official statistics based on race or ethnicity. Supporters consider this colorblind model a defense against communal division. Critics argue that refusing to count racial disparities makes those disparities harder to identify.
Research and testimony have documented discrimination affecting Black residents, people of North African heritage, Muslims, Roma, and residents of disadvantaged suburbs. At the same time, France has powerful civil-rights organizations, large multicultural cities, extensive anti-discrimination laws, and millions of residents who reject racist politics.
Calling France “Europe’s most racist country” based on one old survey question would therefore be excellent clickbait and poor social science.
How to Read Maps of Europe’s Most Racist Countries
Check the Date
A map based on data from the 2000s or early 2010s should not be presented as a live reading of Europe today. Social attitudes change, and some shift surprisingly quickly.
Identify the Question
Was the survey asking about neighbors, migrants, Muslims, Roma, Jews, Black residents, or personal discrimination? Each question measures a different part of the problem.
Examine Who Was Interviewed
Polls of the general population measure expressed attitudes. Surveys of minority groups measure lived experiences. Audit studies, in which researchers submit comparable job or housing applications under different names, measure behavior. The methods should complement one another, not compete in a statistical cage match.
Consider Reporting Differences
Countries with trusted reporting systems may officially record more hate crimes than countries where victims expect the police to ignore them. A higher recorded total can reflect more incidents, better reporting, or both.
Avoid Judging Every Citizen
National averages conceal enormous differences between regions, generations, political groups, neighborhoods, and individuals. Berlin is not a village in Bavaria. Milan is not rural Sicily. Paris is not every corner of France. A border cannot magically turn millions of people into one personality.
Experiences Behind the Map: What the Rankings Cannot Capture
The following examples are composite scenarios based on patterns repeatedly described in discrimination surveys, civil-rights reports, interviews, and studies. They are not presented as one traveler’s personal diary.
The Visitor Who Sees Two Versions of the Same City
Imagine two friends arriving in the same European capital. One is White and American; the other is Black and British. They stay in the same hotel, visit the same museums, and eat at the same restaurants. The first traveler describes the city as wonderfully welcoming. The second traveler also enjoys the trip but notices security staff following him through a store, a nightclub suddenly becoming “full,” and strangers repeatedly asking where he is “really” from.
Both accounts may be sincere. Travel experiences are shaped by skin color, language, clothing, nationality, gender, class, neighborhood, and pure luck. A tourist who spends four pleasant days near famous landmarks cannot disprove the experiences of residents who have searched for apartments or jobs for years.
The Job Applicant Whose Name Changes the Conversation
Consider a university graduate who speaks the local language fluently and has citizenship in the country where she was raised. Her qualifications appear ideal, yet applications sent under her real North African or West African name receive few responses. When a comparable application uses a name associated with the ethnic majority, interview invitations suddenly appear.
Nothing openly racist needs to be said. There is no villain twirling a mustache beneath a neon sign reading “Discrimination Department.” The unequal outcome emerges through dozens of quiet decisions: assumptions about language, concerns about customers, guesses about cultural “fit,” or an employer’s belief that another candidate simply felt more familiar.
This is why attitude maps alone are inadequate. People often describe themselves as fair while making biased decisions they rationalize as practical.
The Family That Is Welcomed Until It Needs Housing
A migrant family may be treated warmly by coworkers and neighbors yet encounter a wall when searching for an apartment. Listings disappear after the landlord hears an accent. Extra deposits are requested. Families with Roma surnames, Muslim clothing, or foreign documentation may be told that an available home was rented five minutes earlieran apartment with astonishing speed and suspiciously selective legs.
Such experiences rarely become national headlines. Individually, each rejection can be explained away. Collectively, they influence where minority families can live, which schools their children attend, how long they commute, and whether they can build wealth.
The Second Generation’s Different Expectations
First-generation immigrants sometimes compare their opportunities with conditions in the country they left. Their children usually compare themselves with classmates born in the same hospital and educated in the same schools. A parent may view stable employment as a major success, while a second-generation professional becomes frustrated after repeatedly being treated as a foreigner in their only homeland.
This difference can explain why discrimination remains politically powerful even in countries where minority incomes, education, and representation have improved. Greater inclusion raises expectations of equal treatmentand rightly so.
Positive Experiences Matter Too
Europe is not one endless obstacle course. Minority residents and visitors also describe supportive colleagues, welcoming communities, mixed families, successful businesses, anti-racist campaigns, and friendships that make national stereotypes look absurd. Cities across the continent contain thriving African, Asian, Caribbean, Jewish, Muslim, Roma, and multicultural communities.
Recognizing discrimination does not require pretending that every interaction is hostile. It requires listening when the pattern of experiences differs across groups. The goal is not to award a gold medal in national guilt. It is to identify where institutions and attitudes can improve.
Conclusion: A Map Is a Starting Point, Not a Verdict
Maps claiming to reveal Europe’s most racist countries attract attention because they transform a complicated social problem into an easy visual ranking. Unfortunately, racism refuses to remain inside tidy colored borders.
The older World Values Survey map placed France among Europe’s least racially tolerant countries based on willingness to accept neighbors of another race. Gallup’s migration research highlighted low acceptance in countries including Hungary, Croatia, Latvia, and Slovakia. Surveys of Black residents identified especially high reported discrimination in Germany, Austria, and Finland. Research on anti-Roma prejudice pointed strongly toward Italy, while antisemitism studies produced yet another country pattern.
The responsible conclusion is not that every resident of one country is more racist than every resident of another. It is that racial and ethnic discrimination appears throughout Europe in different forms, affecting different communities with different intensity. Good maps can reveal warning signs. They cannot replace context, history, behavioral research, or the voices of people living through the problem.