Digital signal processing can look intimidating from a distance, like a spaceship dashboard designed by someone who alphabetizes their socks. But FIR filtering, one of the most useful tools in DSP, becomes surprisingly friendly when you place it inside a spreadsheet. Cells, rows, formulas, and charts turn abstract equations into something you can poke, drag, break, fix, and finally understand.
This article explains how a DSP spreadsheet FIR filtering workflow works, why finite impulse response filters are so popular, and how spreadsheet tools such as Excel or Google Sheets can help students, engineers, audio hobbyists, data analysts, and curious humans see filtering in action. No black box. No mystery fog. Just samples, coefficients, multiplication, addition, and a graph that either behaves beautifully or tells you, politely, that your formula has gone on vacation.
What Is FIR Filtering in DSP?
FIR stands for finite impulse response. In plain English, an FIR filter reacts to an input for a limited number of samples and then settles down. That is the “finite” part. Unlike IIR filters, which use feedback and can theoretically respond forever, an FIR filter only uses a fixed window of current and past input samples.
The core FIR equation is simple enough to fit on a sticky note:
Here, x[n] is the input sample, y[n] is the filtered output, and the b values are the filter coefficients, also called taps. Each coefficient decides how much influence a particular sample has on the output. The filter is essentially saying, “I will listen to this sample, a few previous samples, and then make a weighted decision.” Very democratic, but with math.
Why Use a Spreadsheet for FIR Filtering?
A spreadsheet is not the fastest DSP engine in the world. Nobody is replacing a real-time embedded DSP chip with 50,000 rows of Excel formulas and a cup of coffee. However, a spreadsheet is excellent for learning, prototyping, validating simple concepts, and explaining FIR filtering visually.
When you build an FIR filter spreadsheet, each row can represent a time sample. Each column can hold an input signal, delayed copies of that signal, filter coefficients, partial products, and final output. The spreadsheet becomes a transparent laboratory where you can see the convolution process step by step.
This is especially useful for beginners because FIR filtering is convolution. In a spreadsheet, convolution stops being a scary word from a textbook and becomes a practical pattern: multiply matching values, add the results, move down one row, repeat. That is basically a tiny assembly line for signal cleanup.
How FIR Filtering Works in a Spreadsheet
1. Create or Import an Input Signal
The first column usually contains the time index: 0, 1, 2, 3, and so on. The second column contains the input signal. This signal might come from a sensor, microphone, oscilloscope export, CSV file, or a synthetic test signal generated directly in the spreadsheet.
For example, you might create a signal made from two sine waves:
The low-frequency component might represent the useful signal, while the high-frequency component acts like noise. This is a classic DSP teaching setup: one signal behaves nicely, the other runs around the room wearing tap shoes.
2. Choose FIR Filter Coefficients
The coefficients define the filter behavior. A simple moving average FIR filter might use five equal coefficients:
This five-tap moving average filter smooths the signal by averaging the current sample and four previous samples. It acts as a basic low-pass filter, reducing rapid changes while preserving slower trends. It is not fancy, but it is honest work.
More advanced FIR coefficients can be designed using window methods, least-squares methods, or equiripple methods. These techniques help create low-pass, high-pass, band-pass, and band-stop filters with more controlled frequency behavior. In professional DSP work, engineers often design coefficients in MATLAB, Python SciPy, LabVIEW, or specialized filter design software, then paste those coefficients into a spreadsheet for inspection or teaching.
3. Apply the FIR Formula
Once the input samples and coefficients are in place, the spreadsheet calculates each output sample using a sum of products. In Excel, the SUMPRODUCT function is perfect for this because FIR filtering is literally a sum of products.
For a five-tap FIR filter, an output formula might look like this:
In this example, B2:B6 holds five input samples, and F2:F6 holds the fixed coefficients. The dollar signs lock the coefficient range so the formula can be copied down without accidentally moving the coefficients. Spreadsheets love to “help,” and sometimes their help feels like a raccoon reorganizing your kitchen. Absolute references prevent that chaos.
A Simple Example: Five-Tap Moving Average Filter
Imagine you have noisy temperature readings from a sensor. The raw data jumps around slightly because real-world measurements are rarely polite. A five-tap moving average FIR filter can smooth the data.
Example Input Data
| Sample | Input Temperature |
|---|---|
| 0 | 72.1 |
| 1 | 72.8 |
| 2 | 71.9 |
| 3 | 73.0 |
| 4 | 72.4 |
Using coefficients of 0.2 for all five taps, the first full output value becomes:
The filtered value is smoother than the individual noisy readings. As you move down the spreadsheet, the filter window slides forward sample by sample. This sliding calculation is convolution in action.
FIR Filtering and Frequency Response
An FIR filter changes a signal differently depending on frequency. A low-pass FIR filter allows slow variations to pass while reducing faster changes. A high-pass filter does the opposite. A band-pass filter keeps a middle range, and a band-stop filter removes a targeted band.
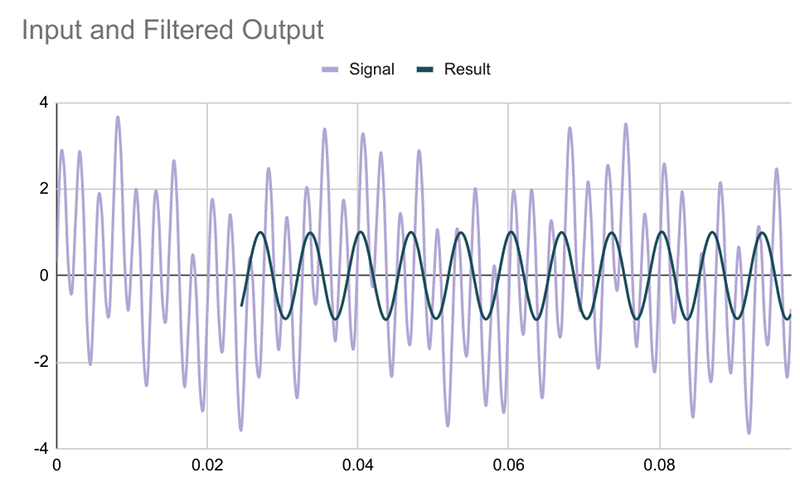
In a spreadsheet, you can observe this by plotting the original signal and the filtered output. If your input combines a slow sine wave and a fast sine wave, a moving average filter should visibly reduce the fast wiggle. The graph may look like the signal finally drank chamomile tea.
For a more technical view, you can calculate or import a frequency response. Excel’s analysis tools, external FFT calculations, or exported Python/MATLAB data can help show how your filter behaves across frequencies. The key idea is that FIR coefficients determine both the time-domain impulse response and the frequency-domain behavior.
Why FIR Filters Are Popular
They Are Inherently Stable
Because FIR filters do not use feedback, they are naturally stable when implemented with finite coefficients. The output depends only on a fixed number of input samples. There is no recursive loop waiting to amplify a rounding error into a mathematical drama series.
They Can Have Linear Phase
One major advantage of FIR filters is that they can be designed with exactly linear phase when their coefficients are symmetric or antisymmetric. Linear phase means different frequency components experience the same delay. This matters in audio, measurement systems, communications, biomedical signals, and other fields where waveform shape is important.
They Are Easy to Understand
FIR filtering is conceptually direct. You multiply samples by coefficients and add them. That makes FIR filters easier to teach, debug, and visualize than many recursive filter structures. In spreadsheet form, the clarity becomes even stronger because every intermediate value is visible.
Common FIR Filter Types You Can Build in a Spreadsheet
Moving Average Filter
The moving average filter is the easiest FIR filter to build. All coefficients are equal, and their sum is usually 1. It is useful for smoothing data, reducing white noise, and demonstrating convolution. Its drawback is that its frequency response is not very selective. It smooths, but it does not perform surgical filtering.
Windowed-Sinc Low-Pass Filter
A windowed-sinc filter offers better frequency control. The ideal low-pass impulse response is based on the sinc function, but because an ideal sinc is infinitely long, practical FIR filters truncate it and apply a window such as Hamming, Hann, Blackman, or Kaiser. The window reduces unpleasant ripple effects caused by abrupt truncation.
High-Pass and Band-Pass FIR Filters
High-pass and band-pass FIR filters can also be implemented in a spreadsheet once coefficients are designed. For example, a high-pass FIR filter can help remove slow drift from sensor data, while a band-pass FIR filter can isolate a range of interest, such as a vibration band in machine monitoring.
Spreadsheet Layout for FIR Filtering
A clean spreadsheet layout makes the learning process much easier. A practical structure might look like this:
| Column | Purpose |
|---|---|
| A | Sample index |
| B | Input signal |
| C | Filtered output |
| E:F | Tap number and coefficient value |
| H onward | Optional delayed samples or partial products |
For beginners, it helps to show delayed sample columns first. For advanced users, a compact SUMPRODUCT formula is cleaner. The educational route is to build the “messy but visible” version first, then replace it with a neat formula after the concept clicks.
Important Details: Delay, Edge Effects, and Coefficient Sum
Filter Delay
FIR filters introduce delay. A symmetric FIR filter with N taps typically has a group delay of (N-1)/2 samples. In charts, this means the filtered output may appear shifted compared with the input. This is not a spreadsheet error; it is the filter doing filter things.
Edge Effects
At the beginning of the data set, the filter does not yet have enough previous samples. You can handle this by leaving early output cells blank, padding with zeros, repeating the first sample, or using a shorter temporary window. Each choice has consequences, so document your decision.
Coefficient Sum and Gain
For smoothing and low-pass filters, the coefficient sum is often normalized to 1 so the DC level is preserved. If the sum is not 1, the output may be scaled up or down. That may be intentional, but if your filtered temperature suddenly says the room is 410 degrees, check the coefficient sum before blaming the thermostat.
Benefits of Using a DSP Spreadsheet for FIR Filtering
A spreadsheet-based FIR filter is valuable because it makes DSP visible. You can see samples move, coefficients apply, outputs form, and graphs change. This is perfect for education, lab reports, quick experiments, and non-programmers who want to understand signal processing without writing C, Python, or MATLAB scripts.
It also helps with communication. If an engineer needs to explain filtering to a manager, client, or student, a spreadsheet can make the process concrete. A row-by-row FIR example is easier to follow than a dense block diagram, especially for people who are comfortable with business or lab spreadsheets but new to DSP.
Limitations of FIR Filtering in Spreadsheets
Spreadsheets are great teachers, but they are not ideal for large-scale or real-time DSP. A long FIR filter with thousands of taps can become slow and awkward. Floating-point precision, formula copying errors, chart scaling, and accidental cell edits can also cause trouble.
For serious production work, use proper DSP tools, programming languages, embedded libraries, or hardware implementations. The spreadsheet is best viewed as a microscope, not a factory. It helps you understand and verify the idea before deploying it elsewhere.
Best Practices for Building an FIR Filter Spreadsheet
Start with a small number of taps, such as three, five, or seven. Use simple test signals before importing messy real-world data. Keep coefficients in a clearly labeled area. Use absolute references for coefficient ranges. Plot the raw and filtered signals together. Add a note explaining how edge samples are handled.
It is also smart to test the filter with known inputs. A constant input should remain constant if the coefficients sum to 1. An impulse input should produce the coefficient sequence as the output. A step input should reveal the smoothing behavior. These tests are like asking the spreadsheet, “Are you awake and doing the thing I asked?”
Real-World Uses of FIR Filtering
FIR filters appear across many fields. In audio processing, they can support equalization, crossover design, room correction, and phase-sensitive filtering. In instrumentation, they help remove unwanted noise from measured signals. In communications, they are used for pulse shaping and channel filtering. In biomedical analysis, they can help clean ECG, EEG, and other physiological signals when designed carefully.
The spreadsheet version is not always the final implementation, but it can be the first clear explanation. For students and professionals alike, that first “aha” moment matters. Once you see FIR filtering as a row-by-row sum of products, advanced DSP becomes less like a locked door and more like a hallway with labels.
Experience Notes: What Working With DSP Spreadsheet FIR Filtering Teaches You
One of the most useful experiences with DSP Spreadsheet: FIR Filtering is discovering how quickly theory becomes practical when every number is visible. In code, a filter may appear as one function call. In a spreadsheet, the same filter becomes a living diagram. You can see the input samples, the tap weights, the products, and the final sum. That visibility is powerful because it exposes both correct behavior and mistakes.
A common early mistake is reversing the coefficient order or selecting the wrong input range. The graph may still look “filtered,” which is dangerous because wrong answers sometimes wear convincing shoes. By testing the spreadsheet with an impulse signal, you can quickly confirm whether the coefficient sequence appears correctly at the output. This simple test can save hours of confusion.
Another practical lesson is that filter delay matters more than beginners expect. When plotting the raw signal and filtered output, the filtered curve often appears shifted. At first, this looks like an error. After a few experiments, it becomes clear that delay is part of the design. For symmetric FIR filters, the delay is predictable, and once you account for it, comparisons become much cleaner.
Spreadsheet FIR filtering also teaches respect for coefficient design. A moving average filter is easy and useful, but it is not magic. It can reduce noise, yet it may blur sharp transitions or leave unwanted frequency components behind. When you replace equal coefficients with a windowed-sinc design, the difference becomes obvious. The output improves, the frequency response becomes more controlled, and the spreadsheet starts to feel like a small DSP workshop instead of a math worksheet with ambitions.
Working in spreadsheets also encourages good documentation habits. Labeling sample rate, cutoff frequency, tap count, coefficient source, and normalization makes the file understandable later. Without labels, yesterday’s brilliant filter becomes today’s haunted spreadsheet. Future you deserves better.
Finally, the spreadsheet approach builds intuition that transfers directly to programming. After creating formulas row by row, writing the same FIR filter in Python, C, MATLAB, or embedded code becomes easier. You already understand the loop: take samples, multiply by coefficients, add, store output, move forward. The spreadsheet turns FIR filtering from a formula you memorize into a process you actually understand.
Conclusion
DSP Spreadsheet: FIR Filtering is a practical way to learn one of the most important ideas in digital signal processing. FIR filters are stable, understandable, flexible, and ideal for visual exploration. A spreadsheet makes the convolution process transparent by showing how input samples and coefficients combine to create each output value.
Whether you are smoothing noisy sensor data, learning DSP fundamentals, explaining filters to a class, or validating coefficients before writing code, a spreadsheet FIR filter is a surprisingly effective tool. It will not replace professional DSP software or optimized hardware, but it can make the core concept wonderfully clear. And in signal processing, clarity is not a luxury. It is the difference between designing a filter and merely hoping the squiggly line behaves.