Marketing funnel analysis sounds like something a team does in a windowless conference room while everyone nods at a chart they secretly do not understand. In reality, it is one of the most practical ways to find out why people discover your brand, browse your offer, almost convert, and then vanish like they saw the shipping fee and joined a monastery.
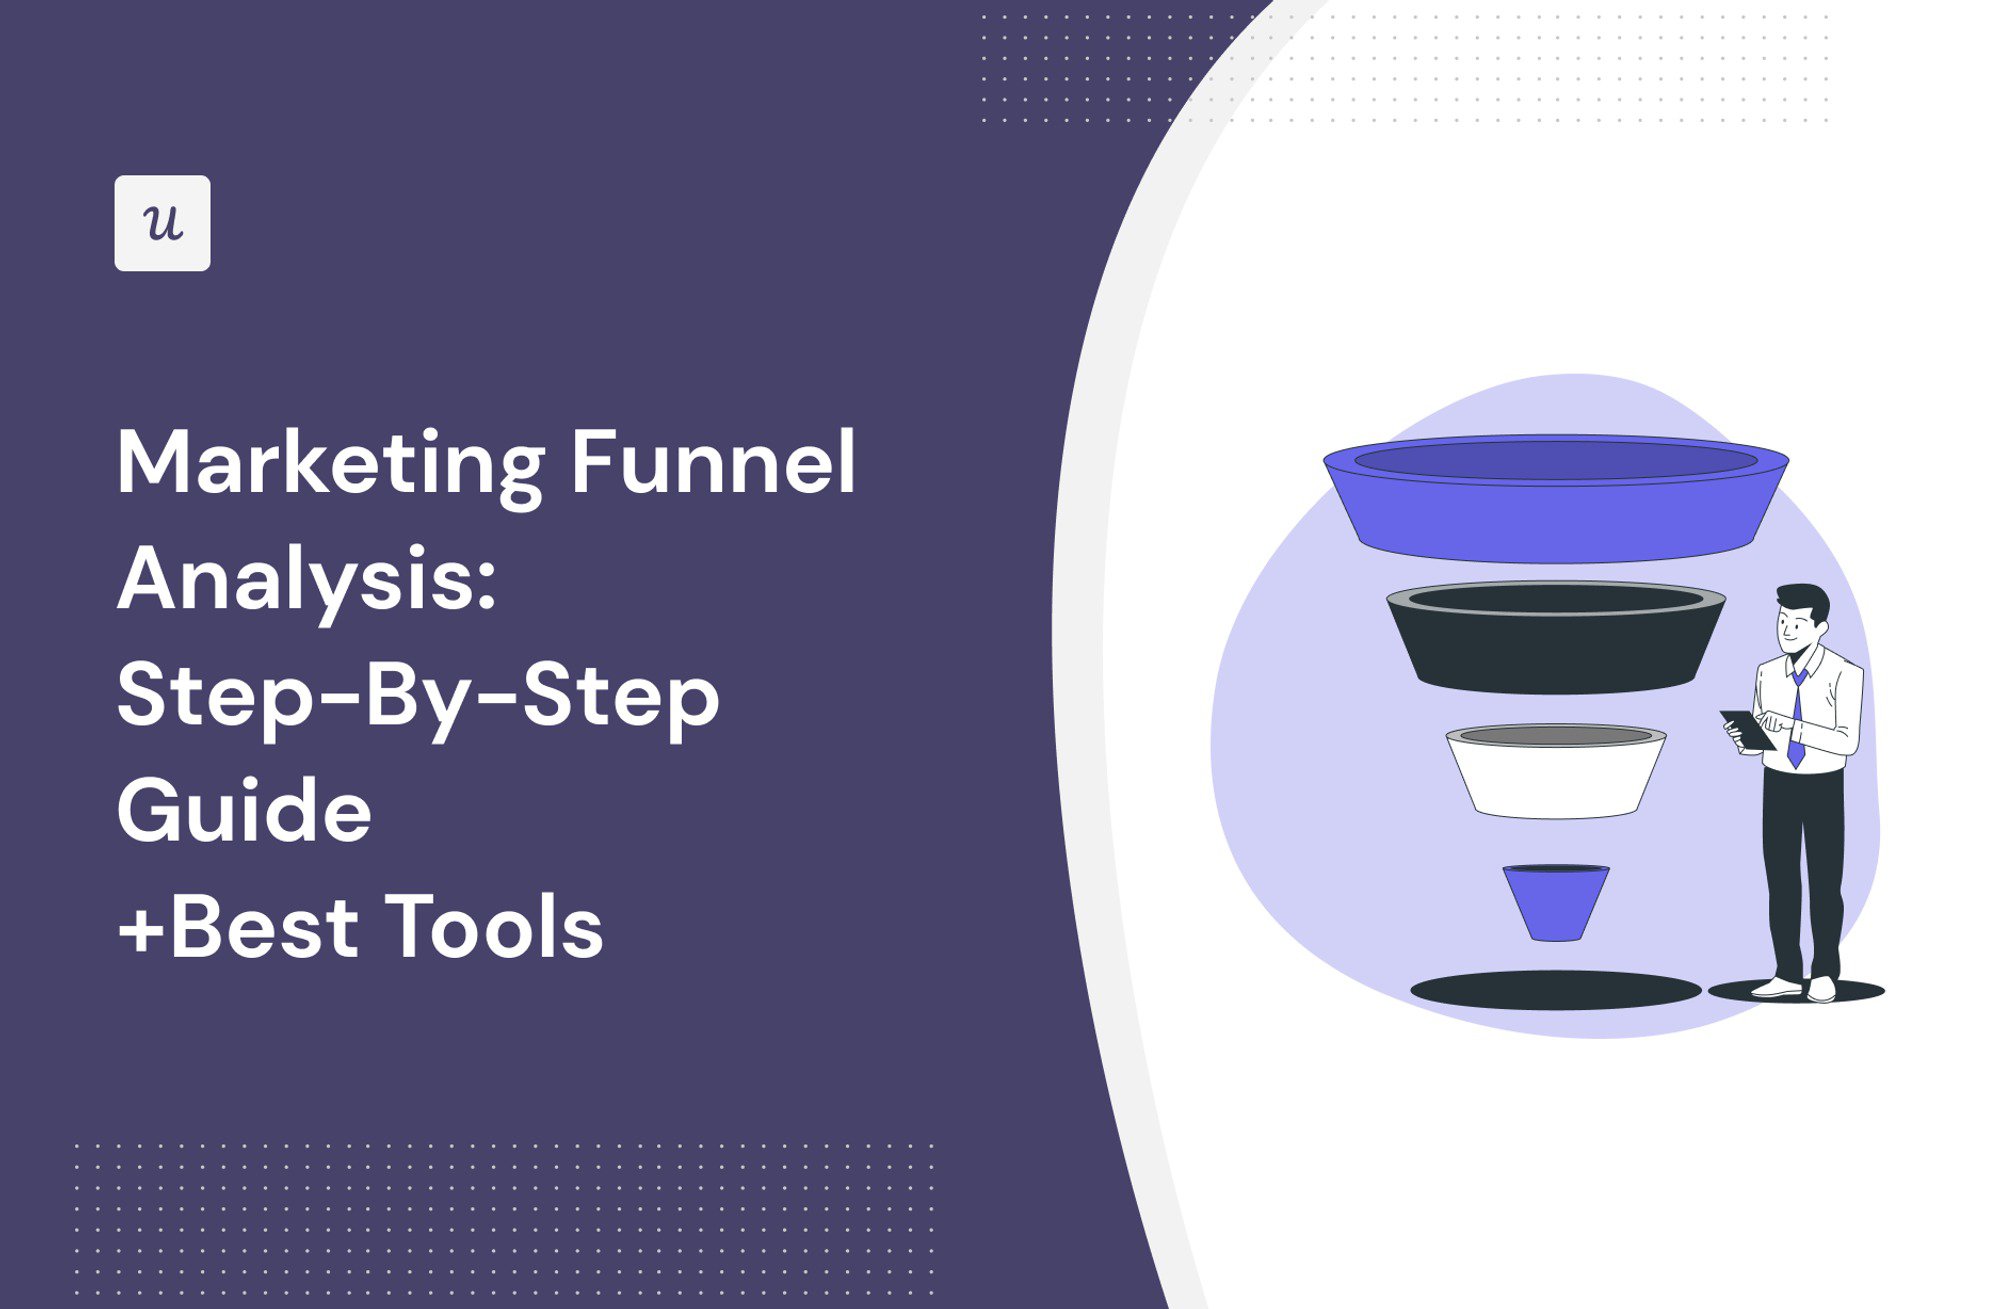
A marketing funnel is the path people take from first awareness to purchase, repeat purchase, and loyalty. Funnel analysis is the process of measuring that path step by step. It shows where prospects move forward, where they hesitate, and where they drop off. When done well, it turns vague marketing anxiety into specific action: improve this page, fix that form, test this offer, follow up with these leads, and stop celebrating traffic that never becomes revenue.
This guide breaks down marketing funnel analysis in plain English, with practical steps, key metrics, useful tools, and real-world examples you can apply whether you run an ecommerce store, SaaS company, service business, agency, newsletter, or B2B sales engine.
What Is Marketing Funnel Analysis?
Marketing funnel analysis is the practice of tracking how users move through defined stages of the customer journey. These stages usually include awareness, interest, consideration, conversion, retention, and advocacy. For a simple ecommerce brand, the funnel might be: ad click, product page view, add to cart, checkout start, purchase, repeat purchase. For a B2B software company, it may look like: blog visit, ebook download, demo request, sales-qualified lead, proposal, closed deal, renewal.
The goal is not to create a beautiful funnel diagram for a slide deck that makes the CEO say, “Nice gradient.” The goal is to answer useful questions:
- Which channels bring the best leads, not just the most visitors?
- Where do users drop off before converting?
- Which content helps prospects move from interest to action?
- Are marketing and sales aligned on lead quality?
- Which experiments should be prioritized first?
In short, funnel analysis helps you find the leaks. Because every funnel leaks. The question is whether yours leaks a little, like a garden hose, or a lot, like a spaghetti strainer in a thunderstorm.
Why Marketing Funnel Analysis Matters
Many businesses obsess over traffic. Traffic is useful, but it is not the finish line. A website with 100,000 monthly visitors and a weak conversion path can lose to a smaller competitor with sharper messaging, cleaner landing pages, better lead nurturing, and a smoother buying experience.
Funnel analysis matters because it connects marketing activity to business outcomes. It helps teams understand not only what happened, but where and why it happened. If users are clicking ads but not signing up, the issue may be audience targeting, landing page relevance, page speed, or trust. If users request demos but do not become customers, the problem may be qualification, sales follow-up, pricing clarity, or product fit.
Without funnel analysis, marketers often guess. With funnel analysis, they still guess sometimes, but at least they guess with data, which is much classier.
The Core Stages of a Marketing Funnel
1. Awareness
At the top of the funnel, people discover your brand. They may find you through Google, Bing, social media, paid ads, YouTube, podcasts, referrals, or industry newsletters. The key metrics here include impressions, reach, organic sessions, paid clicks, social engagement, branded search growth, and new users.
Useful content at this stage includes educational blog posts, short videos, social content, research reports, beginner guides, checklists, and thought leadership. The visitor may not be ready to buy. They may barely know the problem has a name. Your job is to be helpful before asking for the credit card.
2. Interest
In the interest stage, prospects begin engaging more deeply. They read multiple pages, subscribe to a newsletter, watch a webinar, compare options, or download a resource. Metrics include engaged sessions, email signups, content downloads, scroll depth, return visits, and time on page.
This is where vague attention becomes measurable intent. A person who reads one article may be curious. A person who reads five articles, opens three emails, and joins a webinar is waving a tiny digital flag that says, “I might be interested; please do not ruin this with a terrible sales pitch.”
3. Consideration
At the consideration stage, prospects compare your solution with alternatives. They look for pricing pages, case studies, reviews, feature pages, product demos, FAQs, and comparison content. Metrics include pricing page visits, demo requests, product interactions, comparison-page views, lead scores, and marketing-qualified leads.
This stage is often where content quality has a major impact. Prospects want clarity, proof, and confidence. They are asking: Can this solve my problem? Is it worth the cost? Will it make me look smart, or will I have to explain to my boss why we bought expensive software that nobody uses?
4. Conversion
Conversion is the action that matters most to your business model. It may be a purchase, subscription, booked call, demo request, free trial, quote request, or form submission. Metrics include conversion rate, cost per acquisition, checkout completion rate, form completion rate, sales-qualified leads, revenue, and average order value.
This is the stage where small friction points become expensive. A confusing form, surprise fee, unclear call-to-action, weak guarantee, slow checkout, or missing trust signal can quietly drain revenue every day.
5. Retention and Loyalty
The funnel does not end at purchase. That idea belongs in the same dusty drawer as “just post more on Facebook.” Retention matters because repeat customers, renewals, upsells, referrals, and brand advocacy can dramatically improve profitability.
Metrics include repeat purchase rate, customer lifetime value, churn rate, renewal rate, product usage, net promoter score, referral rate, and customer support trends. Strong retention turns the funnel into a loop, where happy customers create more awareness through reviews, referrals, and word of mouth.
How to Do Marketing Funnel Analysis Step by Step
Step 1: Define the Business Goal
Before building dashboards, decide what you are trying to improve. “Make marketing better” is not a goal. It is a fog machine. A stronger goal sounds like: increase demo requests by 20%, reduce checkout abandonment by 15%, improve lead-to-customer conversion, increase free-trial activation, or grow repeat purchases.
Start with one primary conversion goal. Then define secondary goals that support it. For example, if the primary goal is more demo bookings, secondary goals might include pricing page visits, case study views, webinar registrations, and email engagement from target accounts.
Step 2: Map the Actual Customer Journey
Do not assume the customer journey follows your internal org chart. Customers do not wake up thinking, “Today I shall move elegantly from TOFU to MOFU.” They bounce between search results, social posts, review sites, emails, sales calls, and competitor pages.
Create a journey map that includes major touchpoints: ads, organic search, landing pages, product pages, email sequences, chat, sales calls, checkout, onboarding, support, and post-purchase communication. Add customer questions and emotions at each stage. This helps your team see where the experience feels smooth and where it feels like assembling furniture without instructions.
Step 3: Choose Funnel Stages and Events
Once the journey is mapped, translate it into measurable funnel steps. For an ecommerce business, the funnel could be:
- Product page viewed
- Add to cart clicked
- Checkout started
- Payment information entered
- Purchase completed
For a B2B SaaS company, the funnel could be:
- Website visit from target channel
- High-intent page viewed
- Lead form submitted
- Demo attended
- Opportunity created
- Deal closed
Be specific. “Engagement” is too broad. “Clicked request-demo button” is measurable. “Interest” is vague. “Visited pricing page twice within seven days” is much better.
Step 4: Set Up Tracking Correctly
Bad tracking creates bad decisions. Before analyzing anything, make sure your analytics setup captures the right events, conversions, user properties, traffic sources, and revenue data. Use consistent naming conventions. Avoid event names like “button_click_2_final_reallyfinal” unless your analytics plan was written during a caffeine emergency.
Common tracking elements include page views, form submissions, button clicks, product events, checkout steps, email clicks, lead source, campaign parameters, CRM lifecycle stages, and revenue. For B2B companies, connect marketing analytics with CRM data so you can see which channels create qualified pipeline, not just leads with suspicious Gmail addresses and heroic levels of curiosity.
Step 5: Measure Conversion Rate Between Each Step
The heart of funnel analysis is step-by-step conversion. Do not only measure the final conversion rate. Break it down. If 10,000 people visit a landing page, 1,000 click the CTA, 300 start the form, and 90 submit, each step tells a story.
Use this simple formula:
Step conversion rate = users who completed the next step ÷ users who entered the previous step × 100
If 1,000 users add a product to cart and 400 start checkout, the add-to-cart-to-checkout conversion rate is 40%. If only 120 complete the purchase, your checkout completion rate is 30%. Now you know where to investigate.
Step 6: Identify Drop-Off Points
Drop-off points show where people abandon the journey. Some drop-off is normal. Not everyone who reads a blog post needs your product today. But a sudden drop between two high-intent steps is a flashing neon sign.
Look for unusual patterns. Are mobile users abandoning checkout more than desktop users? Are paid search visitors converting lower than organic visitors? Are enterprise leads getting stuck before demo booking? Are users from one campaign bouncing because the ad promised one thing and the landing page delivered something else, like ordering pizza and receiving a motivational poster?
Step 7: Segment the Funnel
Average conversion rates can hide important differences. Segment your funnel by channel, device, geography, campaign, landing page, new versus returning users, customer type, company size, product category, or lead source.
For example, your overall trial-to-paid conversion rate might be 8%. But when segmented, you may discover that organic search converts at 12%, paid social converts at 3%, and partner referrals convert at 18%. That insight changes budget decisions, content priorities, and follow-up strategy.
Step 8: Combine Quantitative and Qualitative Data
Analytics tells you what happened. User behavior tools, surveys, interviews, and session recordings help explain why. If data shows users dropping from checkout, recordings may reveal rage clicks, broken buttons, confusing fields, or coupon-code anxiety. Yes, coupon-code boxes can cause existential dread. People see an empty discount field and wonder if everyone else is getting a better deal.
Use heatmaps, scroll maps, session recordings, customer surveys, support tickets, sales-call notes, and on-site polls to understand friction. The best funnel analysis blends numbers with real human behavior.
Step 9: Prioritize Fixes
Not every leak deserves immediate attention. Prioritize based on impact, confidence, and effort. A high-traffic landing page with a broken mobile CTA is urgent. A low-traffic blog post with a slightly weak sidebar form can wait.
A simple scoring model works well:
- Impact: How much revenue or conversion lift could this create?
- Confidence: How strong is the evidence?
- Effort: How hard is it to implement?
Start with high-impact, high-confidence, low-effort improvements. This is the marketing equivalent of picking up money from the sidewalk, except the sidewalk is your analytics dashboard and the money has been hiding behind a poorly worded CTA.
Step 10: Test, Learn, and Repeat
Funnel analysis is not a one-time audit. Customer behavior changes. Competitors change. Search results change. Ad costs change. Your website changes because someone “just made a quick update,” and now the form is allergic to Safari.
Use A/B testing where traffic volume supports it. Test headlines, offers, form length, pricing presentation, checkout design, onboarding emails, demo CTAs, trust signals, and page layouts. Document each experiment, including the hypothesis, audience, result, and next action. Over time, this creates a learning system instead of a random pile of marketing guesses.
Best Marketing Funnel Analysis Tools
Google Analytics 4
Google Analytics 4 is a strong starting point for funnel exploration, event tracking, traffic analysis, and conversion reporting. It is especially useful for understanding how users move through website and app events. GA4 works well for teams that need flexible reporting without immediately investing in enterprise analytics.
Google Looker Studio
Looker Studio helps turn data into dashboards. It is useful for combining GA4, Google Ads, Search Console, spreadsheets, and other sources into visual reports. Use it when stakeholders need simple funnel visibility without logging into five different platforms and pretending they remember their passwords.
HubSpot
HubSpot is valuable for inbound marketing, lead tracking, email nurturing, landing pages, CRM reporting, and lifecycle-stage analysis. It is especially useful for companies that want to connect marketing activity with sales follow-up and revenue outcomes.
Salesforce
Salesforce is powerful for B2B sales funnels, pipeline tracking, lead qualification, account management, and revenue reporting. When connected with marketing automation and analytics tools, it can show how campaigns influence opportunities and closed deals.
Adobe Customer Journey Analytics
Adobe Customer Journey Analytics is built for deeper customer journey analysis across channels and touchpoints. It is a strong fit for larger organizations that need advanced segmentation, omnichannel reporting, and customer-level insights across complex journeys.
Amplitude
Amplitude is excellent for product-led funnels, activation analysis, behavioral cohorts, retention, and user-path exploration. SaaS and app companies often use it to understand how product behavior influences conversion and long-term engagement.
Mixpanel
Mixpanel focuses on event-based analytics, product usage, funnels, retention, and user behavior. It is useful when teams need to analyze actions inside a product or app, not just website visits.
Hotjar
Hotjar helps explain user behavior with heatmaps, recordings, surveys, and funnel insights. It is ideal for discovering friction points that traditional analytics cannot fully explain, such as confusing layouts, ignored CTAs, or users repeatedly clicking something that is not clickable.
Crazy Egg
Crazy Egg offers heatmaps, scroll maps, recordings, A/B testing, and conversion analytics. It is practical for landing page optimization, ecommerce testing, and visual behavior analysis.
Semrush
Semrush is useful for content funnel research, SEO analysis, competitor research, keyword planning, and visibility tracking. It helps marketers understand how top-of-funnel content can attract the right audience and support later-stage conversion.
Mailchimp
Mailchimp can support email funnels, audience segmentation, automation, customer journeys, and post-purchase communication. It is a practical choice for small and mid-sized businesses that need email nurturing without building a spaceship control room.
Marketing Funnel Metrics to Track
The right metrics depend on your business, but most funnel reports should include a mix of acquisition, engagement, conversion, and retention numbers.
- Traffic by channel: organic search, paid search, social, email, referral, direct, and affiliate.
- Landing page conversion rate: how well entry pages turn visitors into leads or buyers.
- Click-through rate: how often users take the next step after seeing a CTA.
- Lead conversion rate: the percentage of visitors who become leads.
- MQL-to-SQL rate: how many marketing-qualified leads become sales-qualified.
- Cost per lead: the average cost to generate a lead.
- Customer acquisition cost: the total cost to acquire a paying customer.
- Average order value: the average revenue per purchase.
- Customer lifetime value: the estimated total value of a customer relationship.
- Retention rate: how many customers continue buying or subscribing.
Common Funnel Analysis Mistakes
Analyzing Too Many Funnels at Once
If you try to analyze every journey at the same time, you may produce a dashboard that looks impressive but helps nobody. Start with one key journey: checkout, demo request, free trial activation, lead nurturing, or renewal.
Ignoring Lead Quality
More leads are not always better. If a campaign generates cheap leads that never buy, it is not a growth engine. It is a digital confetti machine. Track lead quality, sales acceptance, pipeline value, and revenue.
Forgetting Mobile Users
Many funnel problems are device-specific. A form that feels acceptable on desktop may feel like tax paperwork on a phone. Always compare mobile and desktop conversion paths.
Trusting Last-Click Attribution Too Much
Last-click attribution gives all credit to the final touchpoint. That can undervalue awareness content, email nurturing, brand search, and social proof. Use attribution as a guide, not a courtroom verdict.
Making Changes Without a Hypothesis
Changing a button color because someone’s cousin read a marketing thread is not strategy. Every test should start with a hypothesis: “We believe shortening the form from eight fields to four will increase demo submissions because users are dropping off at the form step.”
Example: Funnel Analysis for an Ecommerce Store
Imagine an online skincare store with 50,000 monthly visitors. The funnel shows that 8,000 users view product pages, 2,400 add items to cart, 1,100 start checkout, and 330 complete purchase.
The biggest drop happens between cart and checkout. After reviewing recordings and surveys, the team finds three issues: shipping costs appear too late, the return policy is hard to find, and mobile users struggle with the coupon field. The fixes are simple: show shipping estimates earlier, add return-policy reassurance near the cart button, and redesign the coupon field so it does not distract shoppers.
After testing, checkout starts increase. The lesson: the problem was not product interest. People wanted the product. They just needed fewer surprises and a smoother path.
Example: Funnel Analysis for a B2B SaaS Company
A SaaS company gets plenty of blog traffic and ebook downloads, but sales says the leads are weak. Funnel analysis reveals that many leads come from broad educational keywords, while the best opportunities come from comparison pages, integration pages, and webinars.
The team adjusts the funnel. Instead of treating every download as an MQL, they create lead scoring based on fit and intent. A visitor from a target industry who views pricing, attends a webinar, and visits an integration page gets a higher score than someone who downloads a beginner checklist once.
The result is fewer total leads but more qualified conversations. Sales stops complaining quite as loudly. Marketing gets better pipeline data. Everyone wins, or at least the weekly meeting becomes 17% less painful.
Experience-Based Notes: What Actually Works in Funnel Analysis
In practice, the most successful funnel analysis projects usually start small. Teams often want a giant dashboard that shows every campaign, segment, persona, keyword, source, page, lead stage, and revenue outcome. That sounds powerful, but it can quickly become a digital junk drawer. The better approach is to pick one money-related journey and study it deeply. For example, analyze the demo-request funnel before rebuilding the entire website. Analyze checkout abandonment before launching a new ad campaign. Analyze trial activation before doubling the sales team.
One useful experience is to sit with both marketing and sales when defining funnel stages. Marketing may think a lead is qualified because the person downloaded three resources. Sales may think that same lead is not qualified because the company is too small, the budget is unclear, or the contact used a personal email address. When both teams define MQL, SQL, opportunity, and closed-won together, funnel reporting becomes more honest. It may not be as flattering, but it becomes useful. Useful beats flattering every single time.
Another lesson: the scariest funnel leak is not always the biggest percentage drop. Sometimes a large drop at the awareness stage is normal because many visitors are early in their research. A smaller drop near checkout, pricing, demo booking, or contract review may be more valuable to fix because those users have stronger intent. Prioritize leaks based on business impact, not just visual drama. A chart can scream. Revenue whispers. Listen to revenue.
Qualitative research also saves teams from silly conclusions. A dashboard may show that users are abandoning a form. Without user feedback, the team may assume the form is too long. But session recordings or surveys may reveal that the real problem is unclear pricing, weak privacy reassurance, confusing required fields, or a broken autofill experience. Numbers point to the room where the problem lives. User behavior turns on the lights.
Finally, funnel analysis works best as a routine, not an emergency activity. Review key funnels weekly or monthly. Keep a simple experiment log. Record what changed, why it changed, and what happened afterward. Over time, the team builds institutional memory. Instead of repeating the same debates, you develop a clear history of what improves conversion for your audience. That history becomes a competitive advantage because your funnel is no longer a mystery. It becomes a living system that your team can measure, improve, and trust.
Conclusion
Marketing funnel analysis helps you understand how people move from first touch to loyal customer. It shows where the customer journey works, where it breaks, and which improvements are most likely to increase revenue. The best teams do not use funnel analysis to create prettier reports. They use it to make better decisions.
Start with a clear goal. Map the real journey. Track meaningful events. Measure conversion between steps. Segment the data. Investigate drop-offs with both analytics and human behavior insights. Then test improvements one at a time. Do that consistently, and your funnel becomes less of a mystery tunnel and more of a growth system with fewer leaks, better leads, happier customers, and fewer meetings that could have been a dashboard.