Scaling a software company is often described as “pouring fuel on the fire.” That sounds exciting until someone pours fuel on a business with weak retention, an expensive sales engine, and a hiring plan apparently designed by an enthusiastic golden retriever. The result is not hypergrowth. It is usually a very impressive bonfire.
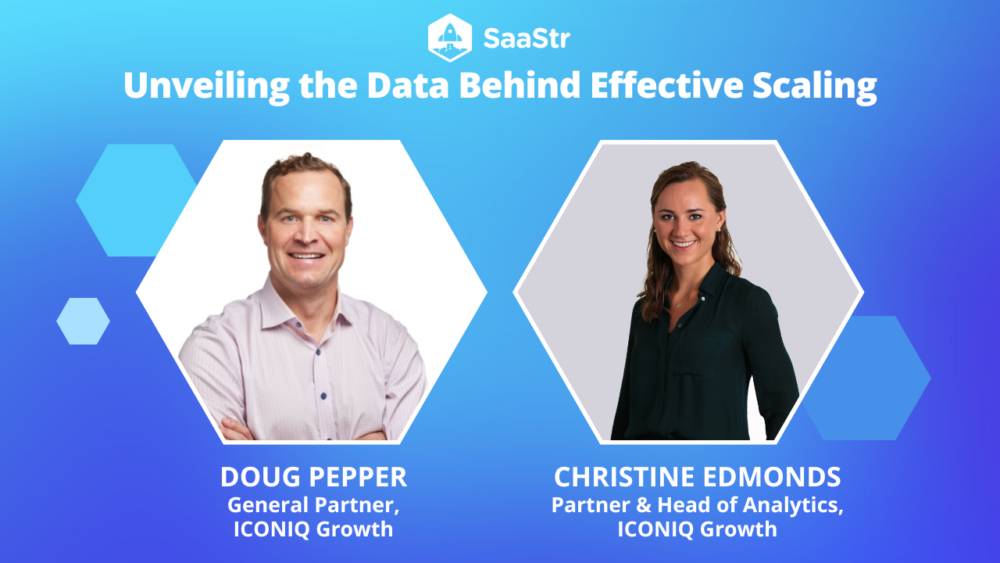
In SaaStr Podcast 637, ICONIQ Growth’s Doug Pepper and Christine Edmonds replace the usual startup slogans with something more useful: operating data. The 28-minute episode, published on February 24, 2023, explores the financial and operational patterns associated with successful enterprise software companies, including growth, customer retention, spending efficiency, and workforce productivity.
The conversation remains valuable because it does not reduce scaling to one magical number. Instead, Pepper and Edmonds present a connected framework for understanding whether a company is growing quickly, retaining quality revenue, spending intelligently, and building an organization capable of supporting the next stage.
Why the ICONIQ Growth Data Deserves Attention
The underlying research examined quarterly operating and financial information from 92 enterprise SaaS companies. Most were ICONIQ Growth investments, while selected public companies were included based on their IPO performance. ICONIQ also surveyed approximately 38 CEOs, CFOs, and CROs about cost management and go-to-market decisions.
That methodology gives the findings more weight than a collection of founder anecdotes. It captures companies at multiple stages, from private growth businesses to organizations that completed IPOs or earned recognition in the Cloud 100. However, operators should remember that the sample naturally leans toward successful enterprise software businesses. A five-person startup selling appointment software to local dog groomers should not blindly copy the spending profile of a late-stage cybersecurity platform.
Benchmarks are maps, not marching orders. They show where strong companies have traveled, but they do not know whether your bridge is under construction.
The ICONIQ Enterprise Five: A Practical Scaling Dashboard
At the center of the research is a framework known as the ICONIQ Growth Enterprise Five. It combines two measures of topline performance with three measures of operational efficiency:
- ARR growth
- Net dollar retention
- Rule of 40 performance
- Net magic number
- ARR per full-time employee
Together, these metrics address five important questions: Is revenue increasing quickly? Are existing customers staying and expanding? Is growth financially responsible? Is go-to-market spending productive? Is the workforce becoming more efficient as the organization scales?
ARR Growth Measures More Than Speed
Annual recurring revenue growth is the most visible scaling metric, but raw percentage growth can be deceptive. A company moving from $1 million to $2 million ARR has doubled. A company moving from $100 million to $150 million has grown by only 50%, yet it added $49 million more recurring revenue.
ICONIQ’s top-quartile companies historically doubled ARR during the years following the $10 million milestone. This trajectory allowed many of them to approach $100 million ARR within approximately three to four years. After reaching that scale, the strongest businesses continued producing meaningful double-digit growth while adding increasingly large amounts of net new ARR.
This distinction matters. Growth percentages normally decline as a company becomes larger, but the absolute amount of new revenue should continue climbing. A mature SaaS business growing 30% may be creating far more economic value than a tiny company growing 100% from a very small base.
Net Dollar Retention Reveals Revenue Quality
Net dollar retention, also called net revenue retention, measures how revenue from an existing customer group changes after renewals, churn, downgrades, and expansion. An NDR above 100% means expansion revenue is greater than lost revenue. The customer base grows even before another salesperson finds a new logo.
In the ICONIQ analysis, many top-performing companies maintained net dollar retention above 120% after crossing $10 million ARR. Expansion, upselling, and broader product adoption became major contributors to growth. Yet the speakers also emphasized that expansion cannot replace new customer acquisition. Companies need a steady supply of new logos today to create tomorrow’s expansion base.
This is where some SaaS teams become overly comfortable. Excellent expansion revenue can temporarily disguise a weakening acquisition engine. Eventually, the company runs out of customers to expand. It is difficult to land and expand when the “land” portion has quietly left the building.
Later industry research reinforces the relationship between retention and growth. SaaS Capital’s 2025 private-company study reported that businesses with stronger net revenue retention generally grew faster, while High Alpha’s benchmarking work identified retention and acquisition efficiency as two of the strongest predictors of SaaS performance.
The Rule of 40 Adds Financial Discipline
The Rule of 40 combines a software company’s growth rate with a profitability or cash-flow margin. A business growing 50% with a negative 10% margin reaches 40. So does a mature company growing 20% with a 20% margin.
The framework recognizes that younger companies may reasonably prioritize growth while mature companies should produce more profit. It is not a commandment delivered on stone tablets by a venture capitalist. It is a way to assess whether the tradeoff between growth and profitability creates durable value.
McKinsey has found that strong Rule of 40 performance is associated with superior software value creation, while also emphasizing that each company needs an appropriate balance between growth and margin. Bessemer Venture Partners has similarly argued that markets reward efficient growth rather than growth at any price.
Net Magic Number Tests Go-to-Market Efficiency
The SaaS magic number examines how effectively sales and marketing spending produces new recurring revenue. Although formulas vary slightly, the basic question is simple: How much revenue did the company create from its recent go-to-market investment?
A weak result can indicate long sales cycles, poor lead quality, inadequate onboarding, ineffective sales execution, or a product customers do not urgently need. Before blaming the sales team, leaders should inspect the entire revenue system. Sometimes the representatives are rowing hard; the boat simply has a product-positioning hole in it.
The metric should also be evaluated beside retention. A company can acquire customers efficiently and then lose them six months later. Another may tolerate a longer payback period because its customers remain for years and steadily expand. OpenView’s benchmark analysis therefore recommends examining acquisition efficiency and net dollar retention together rather than celebrating either metric in isolation.
ARR per Employee Measures Organizational Leverage
Personnel commonly represents the largest expense category in a software company. ICONIQ’s analysis found that leading companies increased ARR per full-time employee while keeping annualized operating expense per employee relatively stable. At greater scale, revenue per employee eventually surpassed the corresponding spending level, signaling stronger organizational leverage.
ARR per employee is not an invitation to run the company with three exhausted engineers and an office cactus named Steve. It is a signal about whether revenue is scaling faster than organizational complexity.
Current ICONIQ research suggests that this measure has become even more nuanced. In 2025, ARR per employee outpaced operating expense per employee across the analyzed market, potentially reflecting organizational redesign, offshoring, selective hiring, and AI-supported productivity. ICONIQ also warns that leaders must determine whether those gains are sustainable rather than assuming every smaller team is automatically a better team.
Burn Multiple: How Much Cash Does Growth Consume?
Burn multiple compares cash consumed with net new ARR created. If a company burns $20 million while adding $10 million of net new ARR, its burn multiple is 2.0. Lower is generally better because the company is buying growth more efficiently.
In the episode, Pepper recommends keeping burn multiple below approximately 2.0 while scaling. ICONIQ’s historical analysis showed that stronger companies tended to reduce their burn multiple as they grew. Early in the journey, a business might burn $20 million to add $10 million ARR. Years later, a more developed organization might burn $50 million while adding $50 million ARR, cutting its multiple to roughly 1.0.
The metric is useful because it exposes growth that looks attractive in a revenue chart but financially resembles purchasing twenty-dollar bills for thirty dollars each. Revenue is increasing, everyone is busy, and the runway is disappearing through the floorboards.
Burn multiple should still be interpreted carefully. A temporary product investment, international launch, or enterprise sales buildout may increase spending before revenue arrives. The problem is not one expensive quarter. The problem is an expensive operating model with no credible route to improvement.
What the 2022 Reset Taught SaaS Leaders
Podcast 637 was recorded after the market shifted sharply away from the growth-at-all-costs environment of 2020 and 2021. ICONIQ’s data showed that 86% of analyzed companies missed their original incremental topline plans for 2022. At the same time, 64% burned less cash than planned, demonstrating that many management teams responded quickly when demand weakened.
Common responses included slowing or freezing hiring, reducing software spending, changing go-to-market strategies, improving forecasting, outsourcing selected work, and implementing reductions in force. In the executive survey, hiring slowdowns were the most frequently reported cost-control action.
The deeper lesson is not that layoffs create efficiency. Layoffs are an emergency lever, not a business model. The lesson is that companies should identify problems early enough to make controlled adjustments before the cash balance begins sending threatening emails.
How to Apply the Framework at Each Growth Stage
Below $10 Million ARR: Prove Repeatability
At the earliest stage, founders should concentrate on product-market fit, customer urgency, onboarding success, gross retention, and a repeatable path to new customers. Efficiency metrics matter, but demanding mature-company profitability from a young startup can prevent necessary experimentation.
The key question is whether the company is discovering an engine that can eventually scale. Founder-led sales may work initially, but it often becomes a bottleneck as the organization approaches the next phase. ICONIQ’s broader go-to-market research suggests that many successful companies encounter a growth plateau around $15 million ARR when founder relationships and early-adopter demand can no longer carry the entire revenue plan.
From $10 Million to $50 Million ARR: Balance Acquisition and Expansion
This stage requires a repeatable sales process, clearer segmentation, reliable pipeline creation, disciplined customer success, and stronger frontline management. Companies must continue adding new logos while building expansion pathways through additional seats, products, usage, or business units.
Leaders should track ARR growth, gross retention, net retention, customer concentration, CAC payback, burn multiple, and sales productivity by customer segment. A blended company average may look healthy while one segment is quietly eating cash with a soup ladle.
From $50 Million to $100 Million ARR: Build Leverage
At this stage, informal processes begin breaking. Forecasting must become more accurate, management layers must become stronger, and teams need consistent definitions for pipeline, activation, retention, and expansion.
The goal is not bureaucracy for its own sake. It is coordination. Product, finance, sales, marketing, and customer success must operate from the same economic model. Revenue should begin growing faster than headcount, while the burn multiple and Rule of 40 profile move toward healthier territory.
Beyond $100 Million ARR: Protect Durable Growth
Large software companies should focus on absolute net new ARR, multi-product expansion, enterprise durability, international execution, operating margin, and organizational productivity. Percentage growth will naturally decline, so leaders need to determine whether the company is still adding larger amounts of recurring revenue each year.
They should also resist complexity that does not improve customer value. More products, territories, committees, and vice presidents do not automatically create a platform. Sometimes they merely create a very expensive calendar.
Common Scaling Mistakes the Data Helps Expose
Benchmark Cosplay
A company sees that an elite SaaS business doubled after $10 million ARR and makes doubling its own official plan. Unfortunately, the benchmark company had stronger retention, better product-market fit, larger customers, and an established acquisition engine. Copying the destination without copying the underlying capabilities produces a spreadsheet, not a strategy.
Managing Metrics Separately
ARR growth, retention, profitability, sales efficiency, and employee productivity influence one another. Cutting customer-success spending may improve short-term margin while damaging retention. Hiring a large sales team may temporarily reduce ARR per employee before the new representatives become productive. Metrics need context, timing, and cohort analysis.
Confusing Cost Cutting with Efficiency
Efficiency means producing more customer and business value per unit of investment. Cutting product quality, onboarding, or support may reduce expenses while weakening the company’s future revenue. A smaller fire department is cheaper right up until something catches fire.
Expanding Before the Core Motion Works
International expansion, new customer segments, and additional products can create growth, but they also multiply execution demands. The episode recommends concentrating resources on high-propensity buyers, must-have use cases, and the initiatives most likely to generate durable returns.
Why the Podcast’s Lessons Still Hold Up
Newer market data shows that the exact benchmarks continue to evolve, but the underlying operating principles remain relevant. ICONIQ’s 2025 State of Software report described stabilizing ARR growth, net dollar retention commonly settling around 110% to 120%, and improving efficiency indicators such as CAC payback, burn multiple, net magic number, and Rule of 40 performance.
Other datasets show a wider range of outcomes. SaaS Capital reported median private B2B SaaS growth of 25% in its 2025 survey, while Benchmarkit reported median growth of 26%, median net revenue retention near 101%, and increasing new-customer acquisition costs. These differences illustrate why founders should benchmark against companies with similar scale, contract value, market, funding model, and go-to-market motion.
In other words, the benchmark is not the answer. The benchmark is the beginning of a better question: Why does our performance differ?
Practical Experience: What Operators Learn When Applying the ICONIQ Framework
The first experience many teams have with a scaling framework is slightly uncomfortable. Their dashboards contain plenty of information, but the metrics do not agree. ARR is growing, yet cash burn is accelerating. Net retention is above 110%, but most expansion comes from three giant customers. Sales productivity looks strong, although customer acquisition costs exclude several marketing programs and implementation expenses. Everyone has a green chart. Finance still looks worried.
A more useful operating process begins by defining every metric precisely. ARR should exclude one-time services and uncertain contracts. Net retention should use stable customer cohorts. Burn multiple should be calculated consistently. Headcount data should include contractors when contractors perform work that would otherwise require employees. This cleaning stage is not glamorous, but neither is discovering during a board meeting that three departments have three definitions of “new ARR.”
Next, experienced teams segment the numbers. Imagine a fictional SaaS company with $20 million ARR and 45% annual growth. Its blended net retention is 112%, which appears healthy. When management separates customers by size, however, enterprise accounts show 125% NDR while small-business accounts show 88%. The company is not dealing with one retention system. It has two different businesses wearing the same logo.
The leadership team can now make a real decision. It might improve onboarding and packaging for smaller customers, raise prices to cover the support burden, create a lower-touch product experience, or concentrate future investment on the enterprise segment. The benchmark did not make the decision. It exposed where a decision was required.
Operators also learn to separate temporary investment from structural inefficiency. Suppose the company’s burn multiple rises from 1.6 to 2.7 after hiring enterprise representatives. That increase may be reasonable while the team ramps. Management should establish milestones: pipeline created by month three, qualified opportunities by month six, and closed ARR by month nine. If those milestones repeatedly fail, the company is not “investing ahead of growth.” It is funding an assumption that has missed several chances to introduce itself to reality.
Another practical lesson involves headcount productivity. Leaders sometimes respond to a weak ARR-per-employee ratio with broad hiring restrictions. A better response is to locate the constraint. Engineering may be productive while sales territories are too small. Sales may be productive while implementations require excessive manual work. Customer success may be overwhelmed because the product does not support self-service administration. Productivity problems are often workflow or product problems disguised as staffing problems.
The strongest operating teams therefore use the Enterprise Five during planning, not merely reporting. Every major proposal explains its expected effect on growth, retention, margin, go-to-market efficiency, and workforce leverage. A new product may initially reduce efficiency but increase long-term expansion. A pricing change may improve ARR per employee but increase churn. Opening a new market may expand the addressable opportunity while extending CAC payback.
This approach changes executive conversations. Instead of debating whether growth or profitability is more important, leaders discuss the economic tradeoffs of each initiative. That is the real value of the ICONIQ framework. It does not eliminate judgment. It gives judgment better evidenceand fewer opportunities to hide behind a beautifully formatted slide.
Conclusion: Effective Scaling Is a System, Not a Sprint
The enduring message from Doug Pepper and Christine Edmonds is that successful scaling requires both ambition and control. Great SaaS companies grow ARR rapidly, retain and expand customers, build efficient go-to-market engines, improve workforce leverage, and create a credible path toward profitability.
No individual metric tells the entire story. Growth without retention is a leaking bucket. Retention without acquisition eventually runs out of room. Efficiency without investment can become stagnation. Investment without accountability becomes an extremely creative method of transferring venture capital into cloud-computing invoices.
Founders and operators should use benchmarks to diagnose their businesses, challenge assumptions, and plan stage-appropriate improvements. The objective is not to imitate the average company or even the top quartile. It is to understand which capabilities make top-quartile performance possibleand then build those capabilities deliberately.